Data Normalization Strategies for CFPS Plate Assays
Choosing the right normalization method determines whether your CFPS data is biology or noise.
Cell-free protein synthesis plate assays fail for a boring reason more often than an interesting one: the numbers coming off the plate reader aren't comparable to each other. A well in row A and a well in row H can produce identical amounts of target protein and still report different raw signal, and if that difference gets read as biology instead of noise, every downstream conclusion is wrong. Choosing a normalization strategy is not a housekeeping step tacked onto the end of a CFPS workflow. It's the decision that determines whether the data means anything.
How CFPS reaction composition creates variability that normalization must address
Cell-free reactions are chemically busy places. A 2026 eLife paper notes that conventional prokaryotic CFPS buffer systems have historically packed in as many as 35 separate components, and each one is a place where a small error in concentration or prep turns into a measurable shift in reaction output. That's not a design flaw so much as the cost of reconstituting transcription and translation outside a cell: energy regeneration, cofactors, salts, and amino acids all have to be supplied exogenously, and each addition is a fresh source of well-to-well drift.
Lysate prep sits at the center of this. Extract activity varies lot to lot, and that variation shifts baseline yield across an entire plate run, not just a handful of wells. Layer coupled transcription and translation on top of that: RNA polymerase activity, DNA template concentration, and the performance of the energy regeneration system all move independently of one another. A reaction can underperform for two or three unrelated reasons at once and look, from the outside, like a single problem.
Template concentration deserves its own callout. DNA is usually dosed in the nanomolar range in these reactions, and at that scale, a pipetting error that would be trivial in a molarity assay becomes a disproportionate swing in yield. Add to that the extract's own fluorescence background, lysate autofluorescence and endogenous protein activity confound signal-to-noise before the target protein has even started folding, and the picture of a CFPS well gets crowded fast.
Simplifying the buffer helps, but it doesn't fully solve the problem. The 7-component eCFPS system described in that same 2026 eLife paper cuts the number of interacting variables sharply compared to the 35-component systems, and that reduction likely eases some sources of run-to-run noise. It does not, however, remove the need to normalize for lot drift or template-level effects. Fewer moving parts is not the same as zero moving parts.
Reporter protein normalization: sfGFP and luciferase as internal standards
The logic here is straightforward: express a well-understood reporter protein alongside the target, then use the reporter's signal as a stand-in for how well the reaction ran overall. Divide the target's signal by the reporter's, and a lot of the well-to-well noise cancels out.
sfGFP is the most common choice, and for good reason. Plate-reader fluorescence from sfGFP is widely treated as the most objective read on correctly folded protein output, and it works especially well when the target protein doesn't itself fluoresce in the GFP channel. It's also a practical tool for benchmarking a new lysate lot against a known one, or catching a well where a pipetting slip shorted the total reaction volume.
Luciferase, particularly NanoLuc, plays a similar role but earns its place through sensitivity. A common approach to normalizing relative luciferase units (RLU) is to divide each sample's raw luminescence by the mean signal of a designated control group, which lets researchers normalize across batches and even across separate measurement sessions. Because luminescence tends to have a cleaner signal-to-noise profile than fluorescence at low expression levels, it's the better fit when the target protein is a weak producer to begin with.
A more refined version of this idea skips the separate reporter protein entirely and fuses a tag directly onto the target. In split-protein complementation, a HiBiT tag is fused to the target, and the LgBiT large subunit is added after the reaction to reconstitute a functional NanoLuc enzyme; the signal that comes back reports specifically on how much target protein got made, not on the reaction's general health. Split-GFP complementation works on the same principle for fluorescence. A September 2025 iScience paper ran both split-GFP and split-NanoLuc assays in 10.5 microliter reactions at 30°C, with every fluorescence reading normalized against a no-DNA control. The advantage of this approach is architectural: the normalization is baked into the detection chemistry itself, rather than bolted on afterward as a math step.
None of this works, though, if the assumption that reporter normalization depends on breaks: reporter normalization assumes the reporter and the target experience the same reaction conditions. Co-expressing a reporter assumes the reporter and the target are experiencing the same reaction conditions, and that assumption fails when the target itself is the problem, a toxic or aggregation-prone protein that consumes or sequesters reaction components will drag down true reaction efficiency in ways the reporter signal won't reflect, so the correction ends up overestimating how well that well actually performed. Fluorescent reporters are also a non-starter if the target protein or its downstream assay overlaps spectrally with the reporter channel. For a non-fluorescent, non-luminescent target with no split-tag available, reporter-based normalization simply isn't an option, and a different method is needed.
No-DNA controls and what background signal contains
Before any ratio or reporter math happens, there's a floor to establish. The September 2025 iScience study normalized every fluorescence reading in its CFPS assays to a no-DNA, no-template control, and that control is doing something distinct from what a reporter does.
A no-DNA well captures lysate autofluorescence (endogenous chromophores in the extract that light up in GFP-adjacent channels), non-specific luminescence coming from the energy regeneration system, and substrate background in luciferase assays before any reporter protein exists to react with it. None of that is signal. All of it appears in the plate reader signal anyway.
A no-DNA control is a well-level correction, not a lot-level one. It tells you the baseline for this specific plate run, but it says nothing about whether the lysate lot used today is more or less active than the one used last month. That's a different problem requiring a different fix (covered below).
Getting the most out of a no-DNA control means distributing those wells across the plate rather than clustering them at one edge. Edge wells tend to read higher than interior wells because of evaporation during incubation, a spatial gradient that a single corner of no-DNA wells won't catch. Spread them out, and the control actually reflects the plate's real baseline geography rather than one corner of it.
The no-DNA control and reporter normalization should be kept mentally separate, because they solve different problems. The no-DNA well subtracts a floor. The reporter corrects a scale. A complete normalization scheme generally needs both, and skipping one because the other is in place is a common shortcut that undercuts the whole exercise. The iScience study ran its split-reporter constructs at plasmid concentrations low enough that ordinary pipetting variation shifts apparent yield meaningfully, which is exactly the kind of well-to-well noise the reporter normalization step is there to catch.
FITC standard curves and cross-instrument fluorescence calibration
A problem that has nothing to do with the reaction chemistry at all: two identical CFPS reactions, read on two different plate readers, can produce raw fluorescence numbers that simply aren't comparable. Gain settings, optical paths, detector sensitivity, all of it varies instrument to instrument, and that variation can substantially undermine cross-site comparisons.
The fix is a calibration curve built from a known standard rather than the biological sample itself. Run a series of known concentrations of a standard reference dye on each instrument, build a calibration curve from that, and then express sfGFP output in standardized units tied to that reference dye instead of whatever arbitrary fluorescence units that specific reader happens to spit out. Two labs running the same experiment on different hardware are now speaking the same numerical language.
The principle behind FITC normalization is that expressing sfGFP output in standardized units tied to a reference dye can meaningfully reduce interlaboratory variation across multiple sites. That's not a claim that cross-site comparison becomes noise-free; it's the core argument for why this calibration step exists, and it's worth weighing when deciding whether a multisite comparison is even trustworthy without it.
FITC calibration ends up serving three purposes at once. It's a cross-instrument calibration tool, it doubles as an on-site quality check confirming a plate reader is behaving normally before a run starts, and it standardizes units in a way that makes comparing today's data to six-month-old data actually meaningful. Any workflow spanning multiple instruments, multiple labs, or a time period long enough to cross a plate reader's recalibration cycle should have this step built in.
What it will not do is correct for reaction composition, lysate lot activity, or plate geometry effects. Those live in a different layer of the problem and need the methods described elsewhere in this piece. Where FITC calibration pairs well with something else is lot-level reagent QC: if a lysate lot has already been characterized (published sfGFP yield data as part of a lot-acceptance criterion, for instance), then instrument variation becomes the main unknown left to solve for, rather than one uncertainty stacked on top of another.
Dual-reporter ratiometric normalization and its failure mode in low-yield wells
Ratiometric normalization borrows a technique from reporter-gene assays broadly: co-express an experimental reporter and a control reporter in the same well, then compute the ratio between them. Because both reporters live in the same reaction volume, dividing one by the other cancels out well-to-well differences in volume, cell-equivalent, or (in the cell-based version of this assay) transfection efficiency, a logic well established in the broader reporter-gene assay literature.
Translated into CFPS terms, the variability sources this actually addresses are differences in how much lysate got dispensed well to well, local temperature variation across the plate during incubation, and edge effects that systematically suppress or boost yield depending on well position. All three are exactly the kind of noise a ratio is good at absorbing.
But the method has a well-documented weak spot: it performs poorly when the control reporter itself is expressing at low levels, because at low expression, a small absolute error in the denominator turns into a large, biased ratio. Divide by a small, noisy number, and the noise doesn't cancel, it gets amplified.
CFPS carries a specific version of this risk. Templates that are genuinely hard to express, toxic proteins, insoluble targets, poor ribosome-binding-site context, can produce low control reporter signal for real biological reasons that have nothing to do with pipetting error. Ratio that against a target signal, and the correction doesn't clean up the data, it distorts it further. Before applying a ratio to a plate of results, plot the control reporter signal across every well first. Wells falling below a threshold set for that specific system should get excluded or flagged, not divided.
As a rule of thumb, ratiometric normalization earns its keep on high-expressing, well-optimized templates where both reporters come through strong and clean. It's a poor first choice for the initial screen of an uncharacterized variant library, precisely the setting where low-expressing outliers are common and the failure mode described above occurs most often.
BCA and total soluble protein normalization when reporters are not an option
Some targets simply don't cooperate with any of the above. Non-fluorescent proteins without a split-tag, assay chemistries that clash with luciferase substrates, or expression systems where adding a reporter construct would muddy the very thing being studied, all of these push toward a different tool: total protein quantification via the BCA (bicinchoninic acid) assay.
BCA measures total soluble protein in the reaction, and that number becomes the denominator for target abundance measured separately by gel densitometry, ELISA, or an activity assay. What it corrects for is broad: variation in total translational output across wells, capturing both lysate volume differences and lot-to-lot differences in how productive the extract is overall.
What it doesn't correct for is more specific. BCA signal includes every protein in the extract, not just the target, so the target has to be distinguishable from background extract protein by tag, activity, or size, or the normalized number won't mean much. Statistically, total soluble protein yields from BCA need enough replication per condition to separate a real difference from ordinary background noise, so replication planning matters before the experiment runs.
BCA is also just slower and more material-hungry than a fluorescence or luminescence read. That makes it a better match for confirmatory experiments and milligram-scale production QC than for a first-pass screen running through a large variant library. Where it pairs well with something else: lot-level QC data on total protein output, characterized ahead of time, gives BCA results an external reference point rather than leaving them to be judged only against within-plate controls.
Matching normalization strategy to the dominant variability source in practice
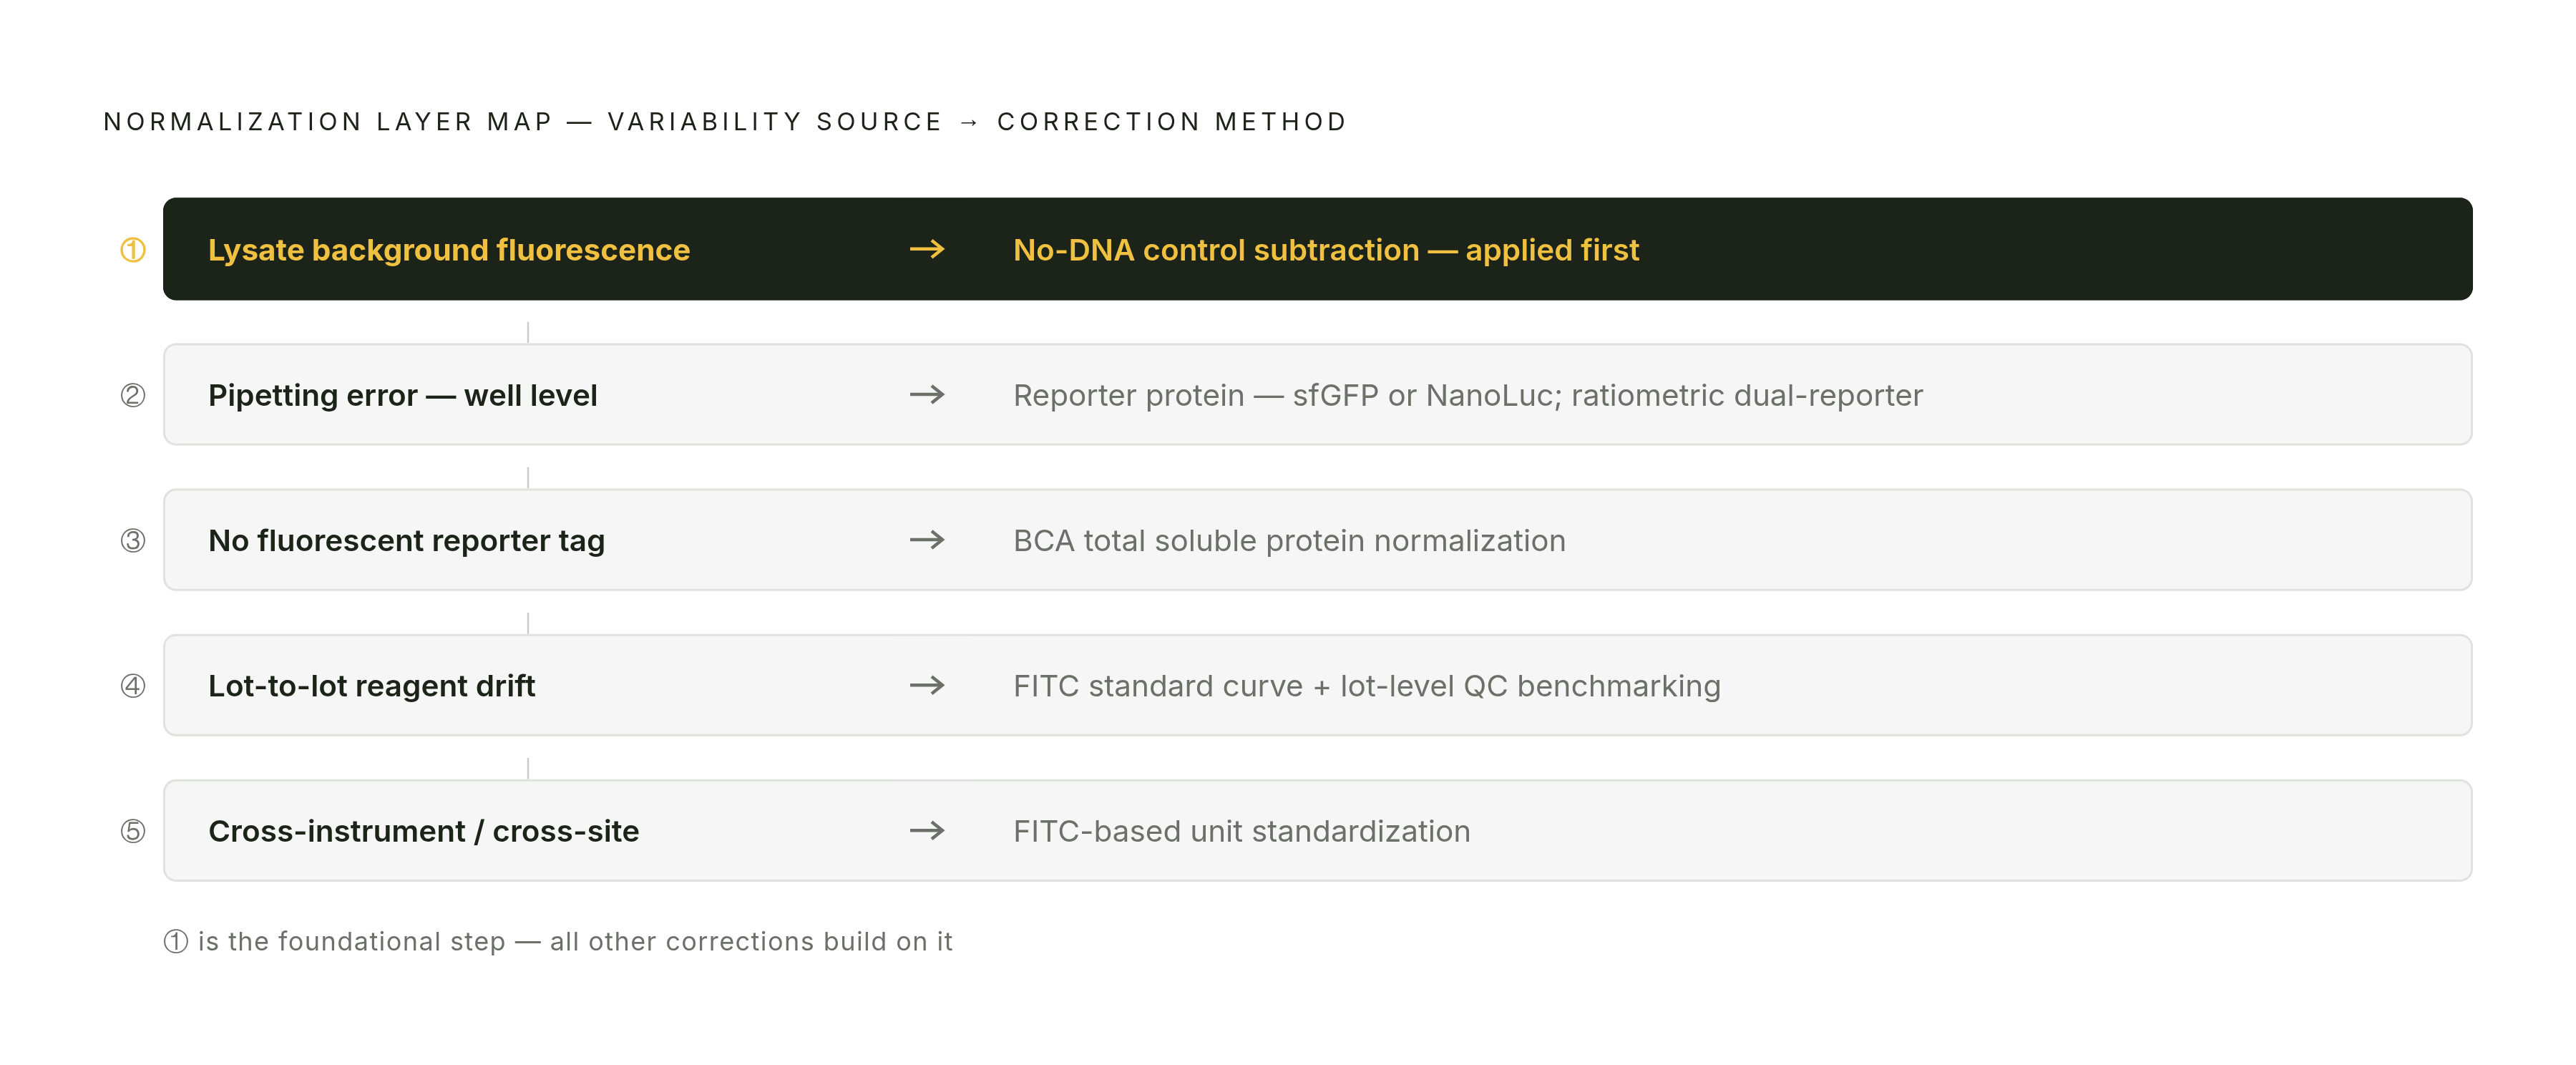
Which variability source dominates the experiment at hand determines the method to use, rather than which normalization method ranks best in the abstract. It's which variability source dominates the experiment at hand, because that answer picks the method, not the other way around.
Pipetting error at the well level points toward reporter protein normalization, sfGFP or NanoLuc run in parallel, or a ratiometric dual-reporter setup if both reporters are expressing robustly. Lot-to-lot reagent drift calls for FITC standard curve calibration paired with lot-level QC benchmarking, using characterized sfGFP lot-acceptance data as an external anchor. Lysate background fluorescence gets handled first, before any other correction, through no-DNA control subtraction. Cross-instrument or cross-site comparison needs FITC-based unit standardization, an approach supported by cross-instrument calibration practice. A non-fluorescent target with no reporter tag falls to BCA total soluble protein normalization. And templates that express poorly or interfere with the reaction should avoid ratiometric correction altogether, falling back on single-reporter or BCA methods with a minimum signal threshold used to flag unreliable wells rather than force a ratio onto them.
These methods stack rather than compete. No-DNA subtraction runs first and produces a floor correction that everything else builds on. Reporter or ratiometric correction handles well-level scale on top of that. FITC calibration handles instrument-level scale above both. Each operates at a different level of the problem, and using one doesn't make the others redundant.
Scale changes the calculus, too. High-throughput screening built around hundreds or thousands of variants, the kind of workflow described in a February 2026 bioRxiv report covering 29,527 unique reaction compositions run across 480 384-well plates, and separately, a January 2025 study from a peer-reviewed journal showing 48 variants produced and screened in six hours in microplate format, cannot rely on someone eyeballing corrections plate by plate. At that volume, normalization has to be standardized and automated ahead of time, because manual, case-by-case correction introduces its own irreproducibility on top of whatever noise it's trying to fix.
Reagent transparency underpins all of it. When a lysate's formulation is documented and lot-level QC data is published, as with the OpenCFPS platform from Sepia Biosciences, researchers get a known reference point to interpret their normalized data against, rather than treating every plate as a closed system with no outside anchor. Normalization as a formality gives a plate a self-contained number; normalization anchored to an external reference gives a reader something they can actually trust.