Reading and Interpreting CFPS Reagent Lot-Level QC Reports
How to read CFPS reagent quality reports to catch problems before opening the vial.

A cell-free protein synthesis reaction is powered by a crude lysate, an ensemble of catalytic proteins drawn from cells that grew, divided, and were broken open under conditions no two production runs reproduce exactly. Growth media composition, the optical density at harvest, the lysis method, the buffer in which the extract was prepared, all of these propagate into how well a given lot drives transcription and translation. No two lots are guaranteed to perform identically, so formal lot-level quality control is a structural requirement, not a commercial nicety.
The open, tunable nature of a CFPS reaction magnifies those upstream differences. In a sealed cell culture, the cell's own regulatory networks buffer small perturbations. In a cell-free system, the reaction environment is a feature rather than a bug, and any drift in extract composition expresses itself directly in yield and activity. Aw (2026) identifies this exact problem in positioning reproducibility and the absence of CFPS-specific quality expectations as persistent barriers to industrial adoption. The field has not yet settled on a standard for what a lot QC report must contain, which means every working scientist is left to build that literacy independently.
Lyophilized reagent formats sharpen the stakes. Shelf-stable, lot-controlled products depend on documentation as the primary channel between manufacturer and bench scientist, because the reagent itself arrives as a powder that reveals nothing about its provenance. A lot number without an accompanying QC report is not meaningfully different from no documentation at all.
How large lot-to-lot variation actually is, and why the gap between controlled and uncontrolled conditions defines the stakes
The distance between chaotic interlaboratory variation and tight lot-to-lot reproducibility is not random. It is a direct function of how well reagent preparation and documentation are controlled, which is precisely what a QC report captures. Cole et al. (2019) established the first quantitative baseline through a multi-lab exchange, and the results frame the entire problem: interlaboratory coefficient of variation was dramatically higher than single-operator variation across days using a single set of materials. The same operators, running the same protocol with the same extract, produced wildly different outcomes across labs, but a single operator working across days stayed comparatively stable.
What drove the scatter inverts the intuitive assumption. The 2019 study found that supplemental reagent preparations, the energy mix, the amino acids, the cofactors, not the extract itself, were the source of observed variability. Extract preparations explained none of it. Scientists have long treated the cell lysate as the QC problem to solve, but the data say the opposite: the extract is the well-behaved component, and the hand-mixed supplements around it are where reproducibility leaks away.
The controlled end of the spectrum shows what tightness actually is. Under documented, held conditions, a yeast CFPS system reported lot-to-lot variability of roughly six percent and within-lot day-to-day variability below five percent. That level of performance is achievable, but only when someone recorded the conditions and held them constant across production runs. The gap between uncontrolled interlaboratory scatter and controlled lot-to-lot reproducibility is where reagent transparency proves its value: a well-documented CFPS system, one where formulations and QC protocols are open and lot-level data are published, turns the QC report from an insurance policy into a genuine communication tool between manufacturer and bench scientist.
Some labs accept variability as intrinsic to CFPS and compensate by running internal controls. The limitation is temporal: internal controls catch problems after the experiment, when reagents, time, and interpretation have already been spent. A QC report read correctly catches problems before reagents are even opened.
Why yield in µg/mL is an incomplete QC metric and what functional activity data must accompany it
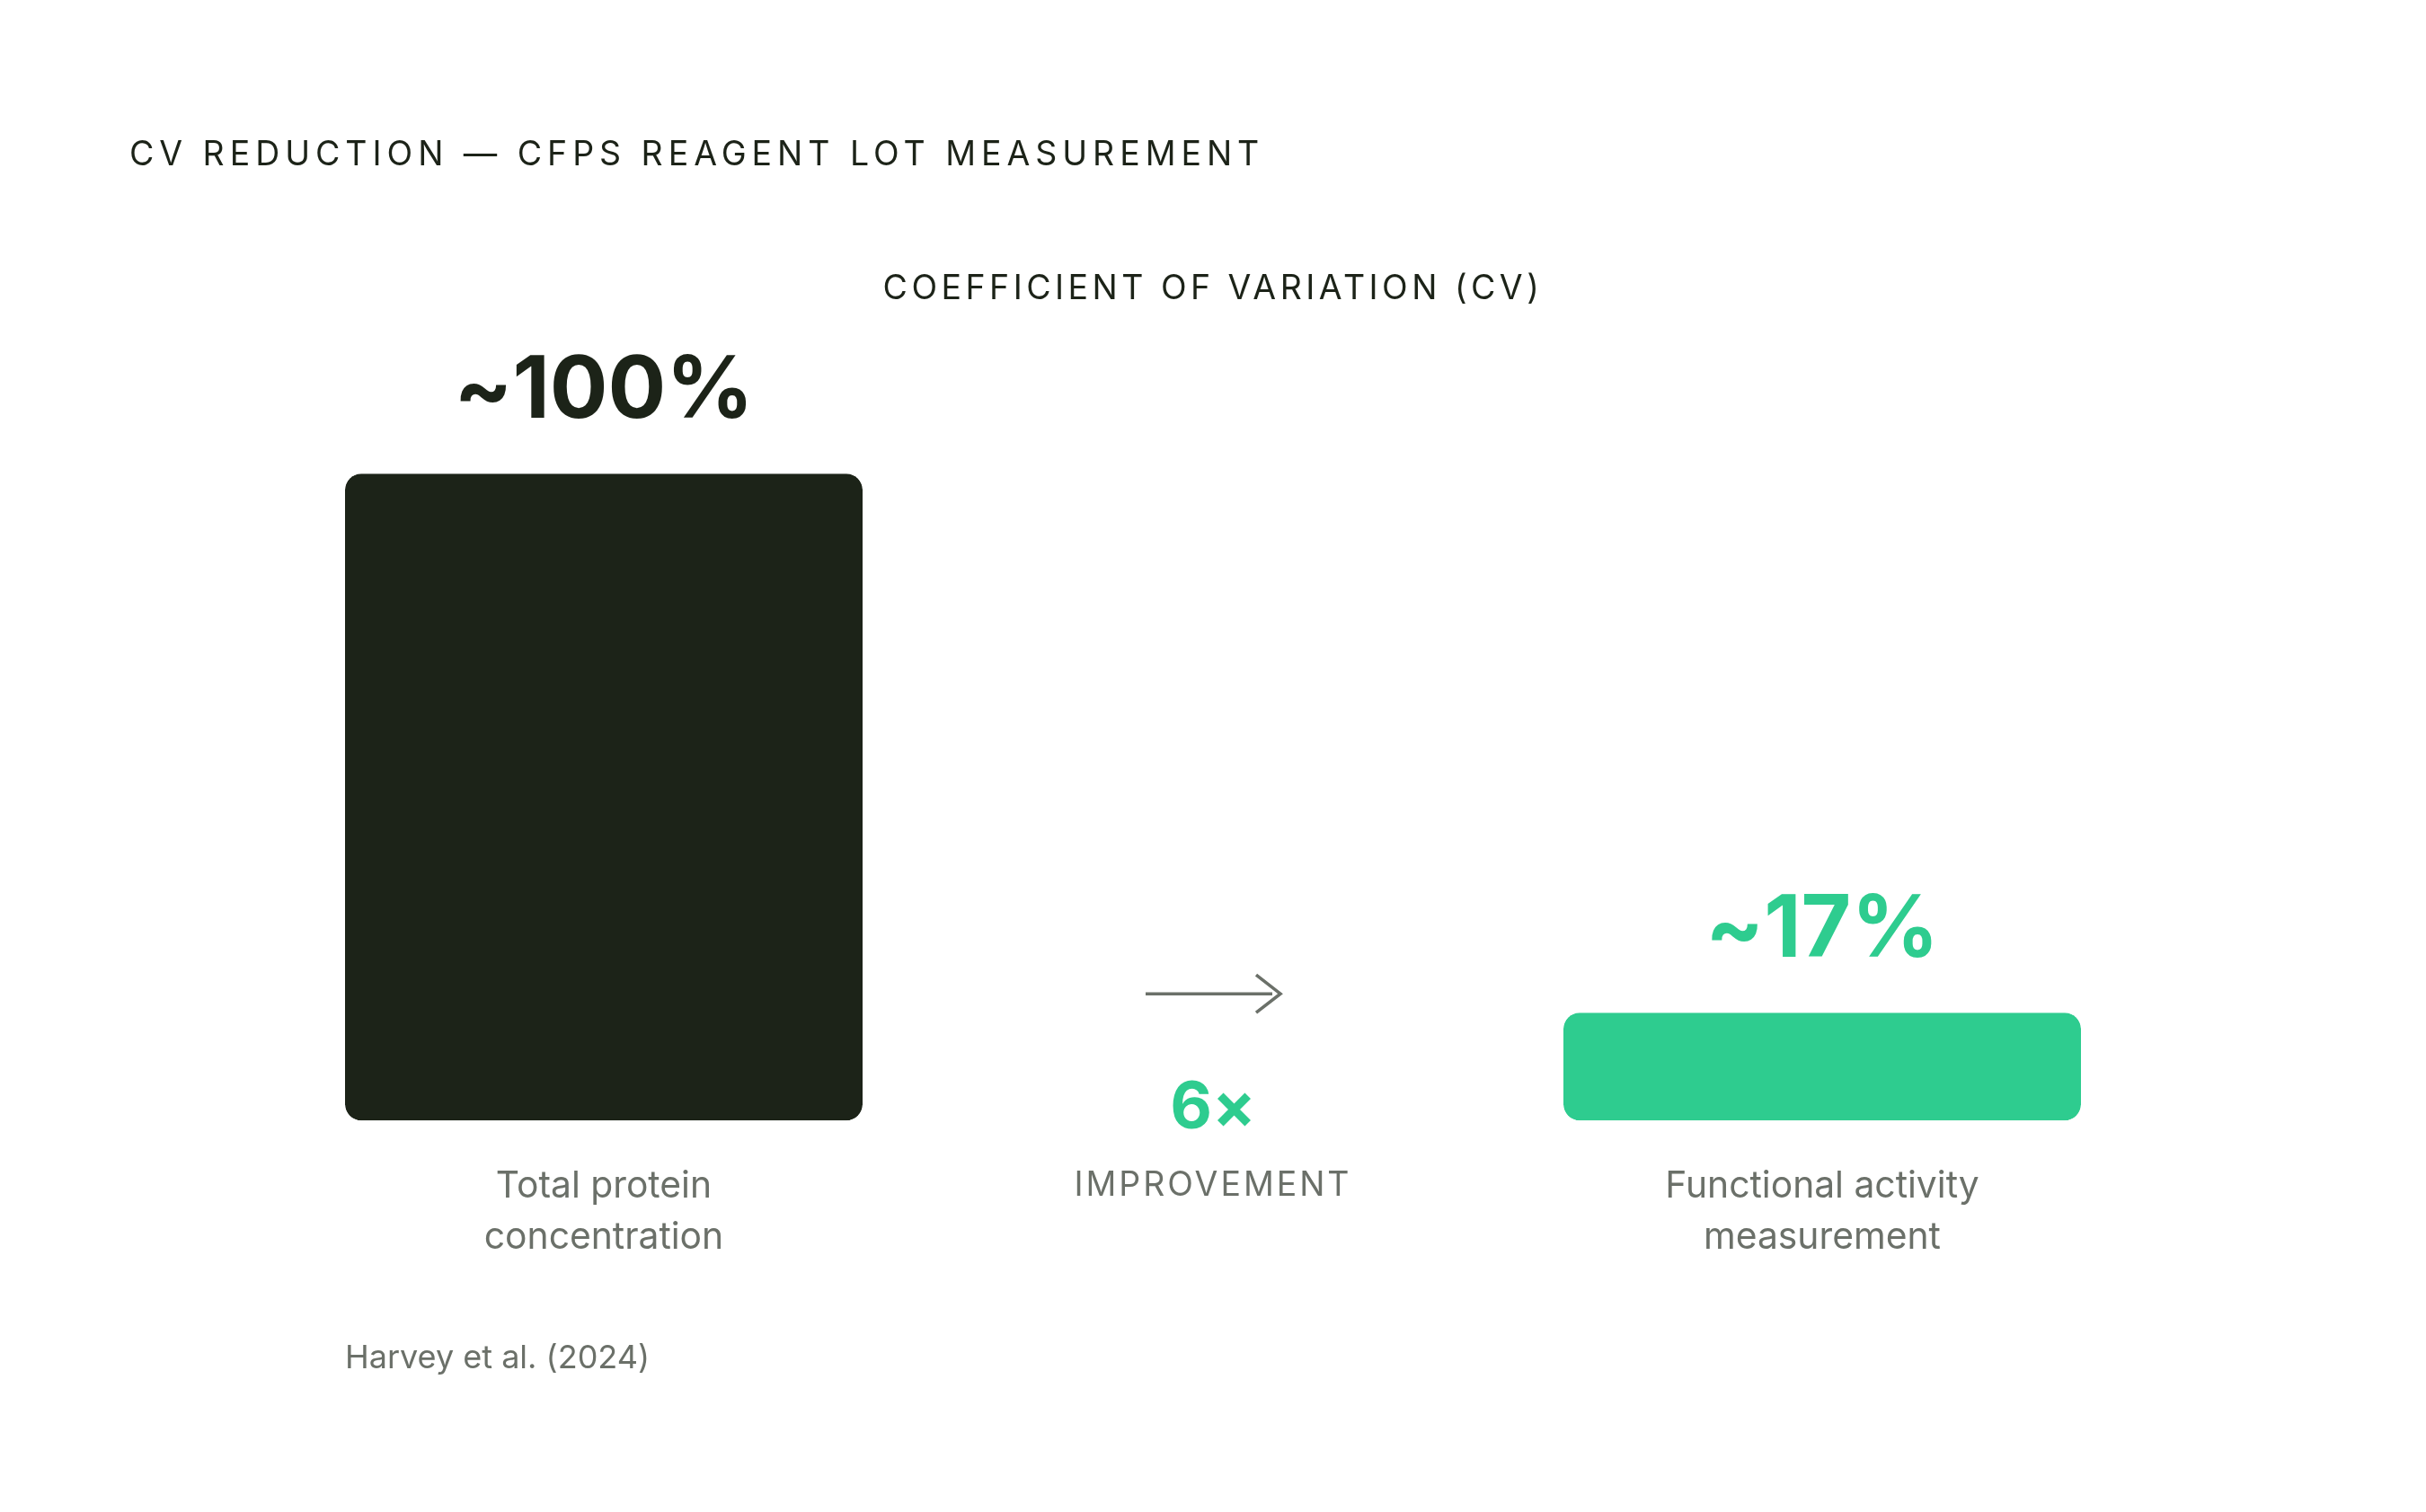
Total protein yield, expressed in micrograms per milliliter, is the most commonly reported CFPS QC metric, and on its own it is systematically misleading. Total protein includes inactive species that contribute to mass but not to function. Harvey et al. (2024) demonstrated this in a protein reagent QC context, where lot-to-lot differences in activity persisted even when total protein concentration appeared equivalent, because traditional total protein measurements cannot distinguish active from inactive species. The study's context is pharmaceutical protein reagents rather than CFPS specifically, but the principle transfers directly: both systems depend on functional protein produced by biological machinery, and both fail when mass is treated as a proxy for activity.
The magnitude of the correction is striking. The same 2024 analysis in Analytical Chemistry found that defining reagents by assay-specific concentration rather than total protein yielded a greater than six-fold improvement in consistency, corresponding to a roughly 600% decrease in coefficients of variation. When you ask what the reagent actually does rather than how much of it is there, the noise collapses.
For CFPS, this means a usable lot QC report must specify how yield was measured, whether by total protein assay or by a functional reporter. The reporter system itself is critical metadata: sfGFP fluorescence, luciferase luminescence, and radioactive incorporation each measure different things and are not directly comparable across reports. A reader should look for the reporter construct, its sequence, the detection method, and whether the yield figure represents peak or endpoint expression. A lot that passes on total yield but fails on functional activity is a lot that will produce misleading results, not no results, which makes it harder to detect. When evaluating a CFPS reagent's QC report, the distinction between total protein and functional activity mirrors the broader principle behind open reagent documentation: you cannot make a reproducible decision on data you do not fully understand, which is why providers committed to transparency report activity-based metrics alongside mass-based ones, and why scientists reading those reports should demand to see both.
The core metrics a CFPS lot QC report should contain and how to read each one
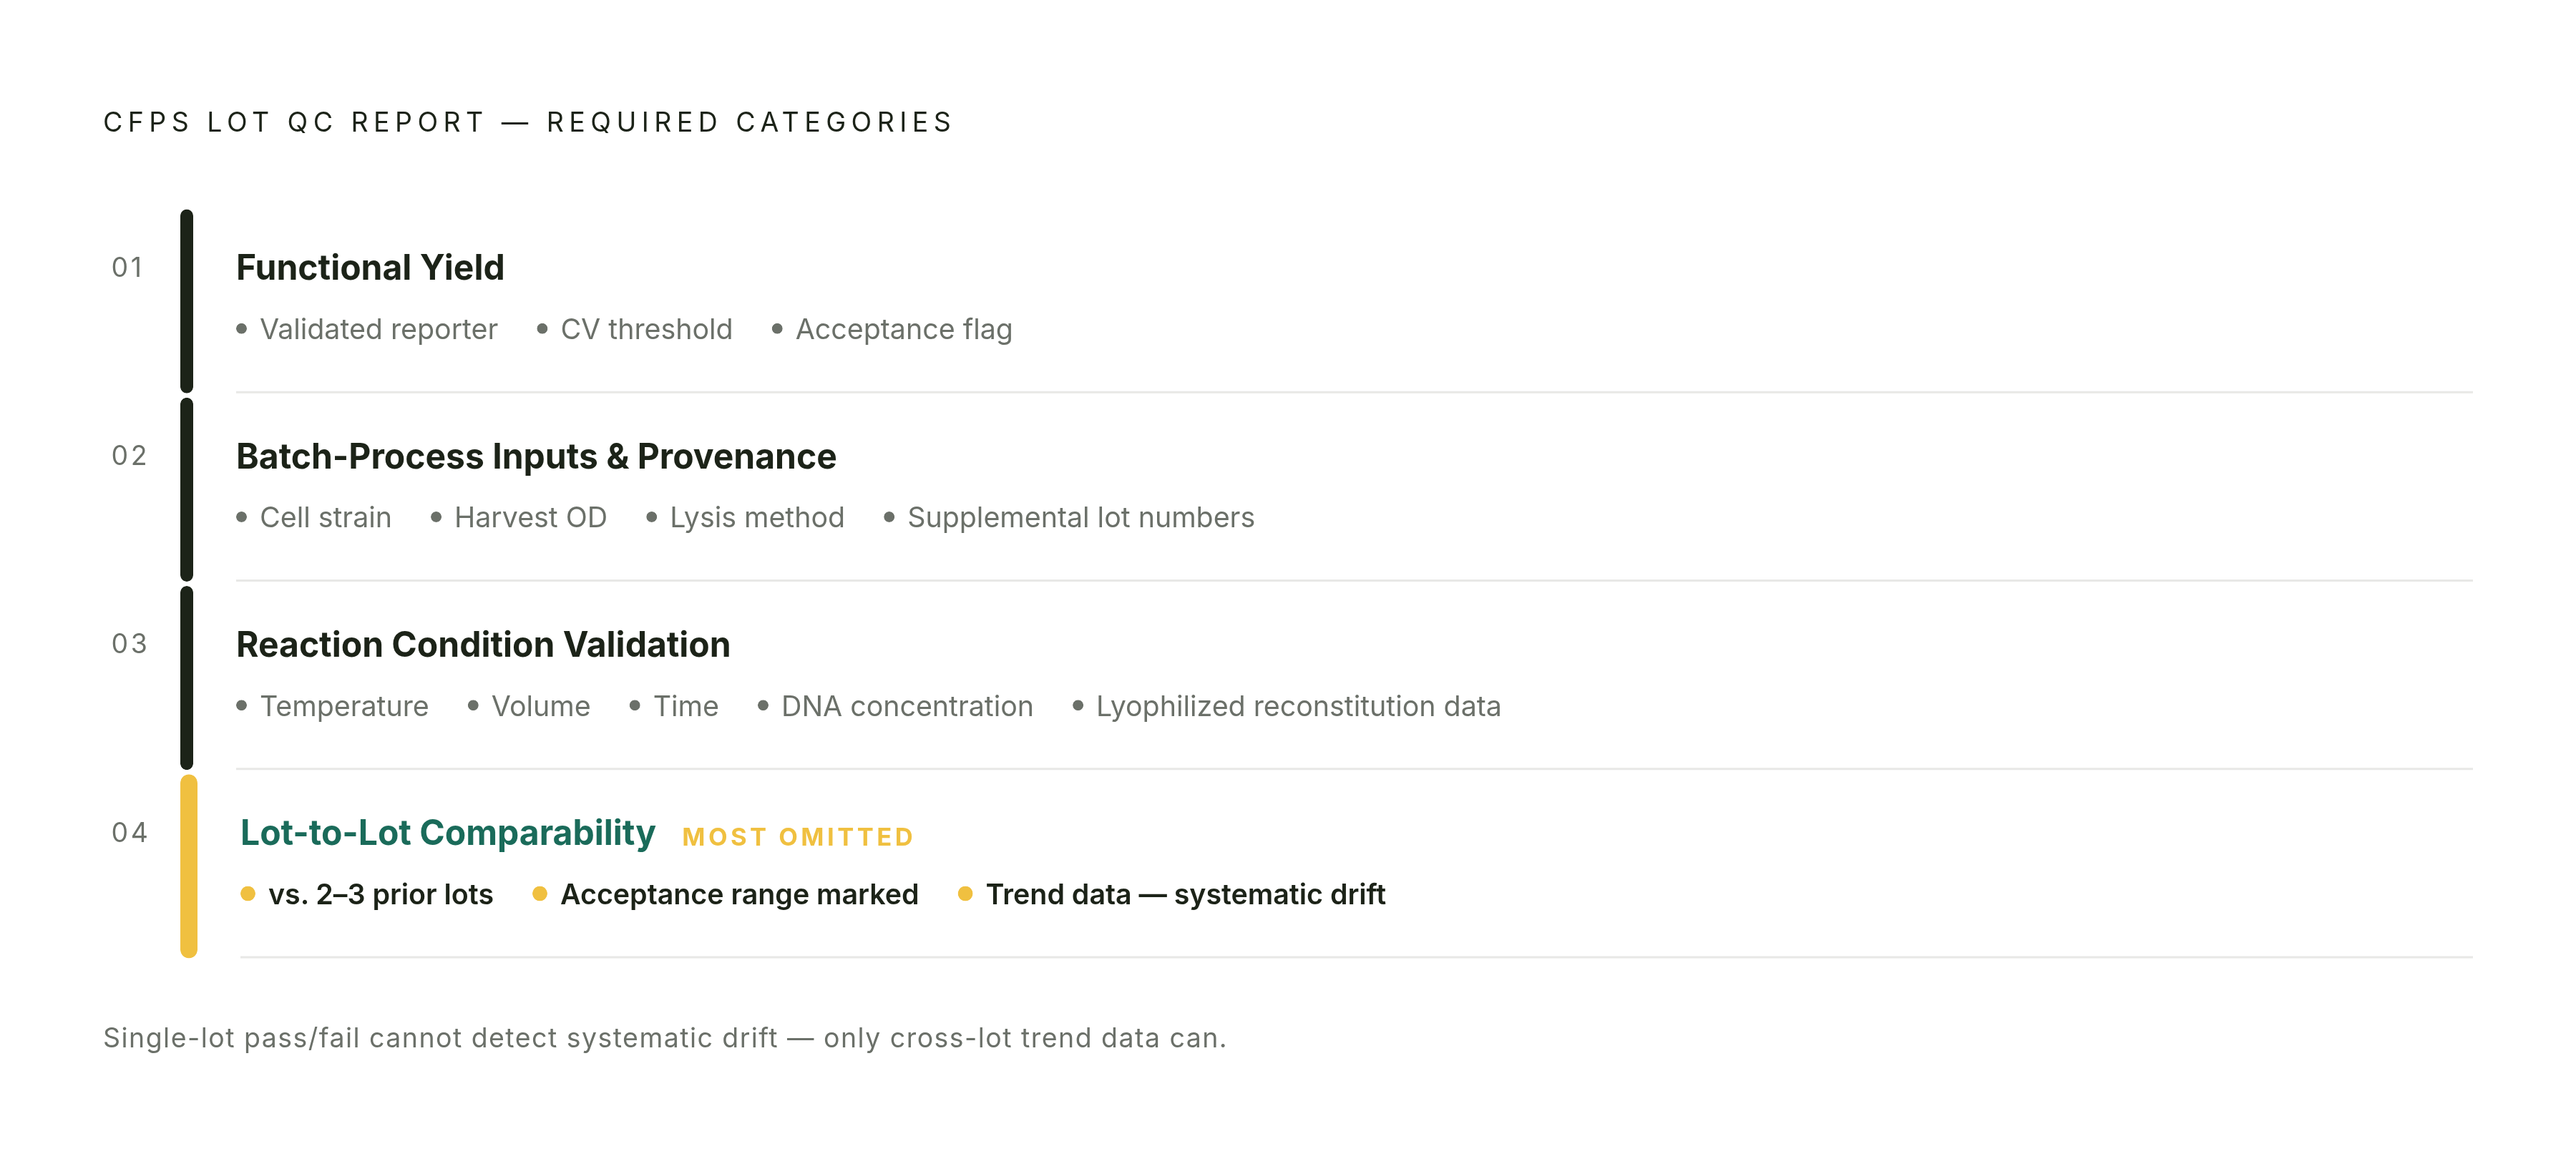
A rigorous CFPS lot QC report addresses at minimum four categories of information: functional yield, batch-process inputs, reaction condition validation, and lot-to-lot comparability. A scientist who knows what each category is asking can interrogate any report against this framework. Functional yield. The expressed protein output per unit volume should be measured by a validated functional reporter, not solely by A280 or BCA. The reporter construct and its detection method must be specified. Acceptable variation is tight within-lot replicates, low single-digit CV, with a stated acceptance threshold. Any lot outside that threshold should be flagged, not silently released.
Batch-process inputs and provenance. Cell strain identity and passage history belong in the report, along with growth curve data confirming harvest at the validated optical density, plus lysis method and buffer composition. Because Cole et al. (2019) showed that supplemental reagents drive interlaboratory variation, not just the extract, the report must document the lot numbers and sources of every supplemental component: the energy mix, amino acids, cofactors. A report that documents the extract lot but not the buffer components is half a QC report.
Reaction condition validation. The report should confirm that the QC reaction ran under the conditions stated in the protocol: temperature, reaction volume, incubation time, DNA template concentration. Those conditions set the boundaries of the lot's characterized performance space. A lot validated at 30°C for two hours is not formally validated for a 37°C overnight run. Lyophilized reagent lots should include reconstitution validation: what volume, what diluent, and what the functional yield was post-reconstitution versus pre-lyophilization.
Lot-to-lot comparability. The current lot's functional yield should be compared to the prior lot or lots using the same reporter and conditions. Without that comparison, a scientist cannot determine whether a performance change in an experiment is biological signal or lot drift. Trend data across multiple lots reveals systematic drift, declining yield over successive batches, that a single-lot pass/fail cannot detect. In practice this looks like a table or chart showing the current lot alongside at least the two or three preceding lots, with the acceptance range marked.
What a QC report cannot tell you and how to supplement it with your own validation experiments
A lot QC report certifies performance under the manufacturer's standard conditions with a standard reporter. It does not certify performance on a scientist's specific protein target, template design, or reaction scale, and closing that gap is the scientist's responsibility. The QC reporter, typically sfGFP or luciferase, is an easy-to-express, well-behaved protein. Challenging targets do not behave that way. Toxic proteins, membrane proteins, multi-domain constructs will not necessarily express at the same efficiency, and a lot that passes QC for sfGFP may still underperform on a difficult target. Accessory factors that promote folding for specific targets can be added directly to a CFPS reaction, but those additives are not part of the standard QC protocol and must be validated separately for each new lot.
The bridging work is straightforward and cheap relative to the cost of skipping it. Before committing a new lot to a large screen, run a small-scale reference reaction with the previous lot's remaining volume alongside the new lot, using the same template and conditions. For high-throughput variant screens, validate lot behavior across the plate format, edge wells versus center wells and evaporation controls, because the QC report is almost never generated in a 384-well format. For milligram-scale production runs, confirm that the linear relationship between reaction volume and yield established for the previous lot holds for the new lot before scaling.
No external standard currently defines what a sufficient lot acceptance experiment looks like. Aw (2026) notes that CFPS-specific quality and regulatory expectations remain to be fully elucidated. The scientist must define their own acceptance criteria for their own application. The added time and cost of this validation is real, but the alternative, discovering mid-screen that a lot underperforms on a difficult target, costs more in wasted reagent, labor, and interpretation errors.
How to use QC data across lots to build an internal reproducibility baseline for your own lab
Literacy in reading a single QC report is the entry point. The larger payoff is building a longitudinal record that makes every future lot decision faster, more defensible, and less dependent on a single vendor's data. For each lot received, a lab should log the lot number, the functional yield from the manufacturer's report, the result of its own bridging experiment using its reference template, the date received, storage conditions, and any anomalies observed.
Over time that log reveals the lab's own lot acceptance range, which may be tighter or different from the manufacturer's stated range depending on the protein targets and scale in play. A lab that has expression data for five or more lots can distinguish a genuinely out-of-specification lot from a biological result reflecting template or assay variation. Without that history, the two are confounded. For high-throughput screening workflows specifically, lot-bridging data across the library run, not just a pre-run check, protects against within-lot performance drift over the duration of a large campaign.
Reagent transparency from the manufacturer is a prerequisite for this practice. A lot QC report that omits process inputs, strain, buffer composition, supplemental component lots, cannot be correlated with lab-side performance data in any useful way. Sepia Biosciences publishes lot-level QC data and documents OpenCFPS™ formulations openly, giving labs the process-level metadata needed to build this kind of longitudinal correlation. The documented formulation is what makes the lab's own bridging data interpretable across lots. And that is the practical outcome of everything the article has built toward: a lab that maintains its own lot log is no longer wholly dependent on a vendor's QC report to make decisions. It has its own reproducibility infrastructure, built from the same data, read with the same discipline, and held to the standard its own experiments actually require.